|
<< Click to Display Table of Contents >> Dashboard |
  
|
|
<< Click to Display Table of Contents >> Dashboard |
|
When first launching WhisperReporter Ascent, you are presented with the Dashboard.
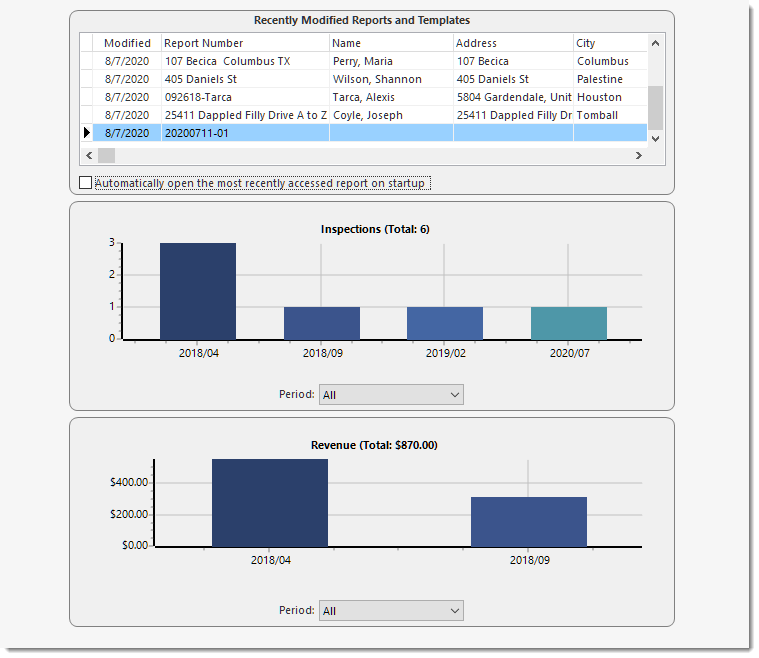
The Dashboard presents you with a list of the last five most recently modified reports (as opposed to the last accessed reports). Just double click the report in the list you want to work on (of course you can always browse all reports to pick one not in the recently modified report list shown in the dashboard). The intention is that you probably want to work on a report you have recently been working on.
You will also see two charts, the top showing the inspections by month and the other chart shows the revenue by month. You can use the drop down to select various time periods rather than showing all of them.
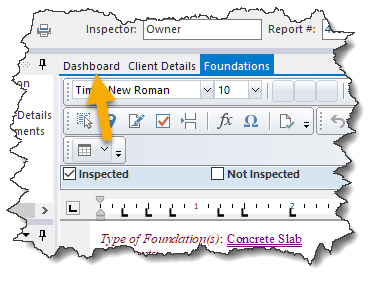
The Dashboard will be the default screen that loads each time you start WhisperReporter Ascent. However, you can check the option "Automatically open the most recently accessed report on startup" to open the last report you accessed (not necessarily the last one you modified) instead of opening onto the Dashboard. If you use this option, you will still have the ability to look at your dashboard without needing to close the report you currently have open by selecting the Dashboard tab at the top of the editor window: